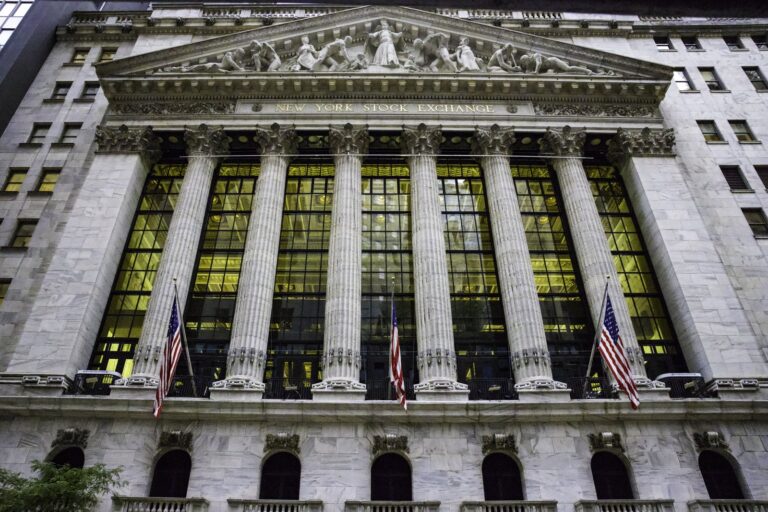
NEW YORK, January 3 — The Dow Jones Industrial Average fell 500 points today, closing at 28,634.88. That 1.8% decline marks the index’s worst single-day performance since December 3, 2019, when it dropped 799 points amid trade war uncertainty. The S&P 500 lost 1.7% to settle at 3,234.85, while the Nasdaq Composite fell 1.6% to 9,020.77.
The figure that matters for investors: the S&P 500 shed approximately $500 billion in market capitalization in a single session. The Dow’s 30 component stocks lost about $150 billion in market value combined.
By the numbers, the selloff was broad but not uniform. Technology stocks led the decline, falling 2.1%. The energy sector, by contrast, rose 1.2% as oil prices climbed.
West Texas Intermediate crude gained 3.1% to $63.05 per barrel, and Brent crude rose 3.5% to $68.60 per barrel. Gold prices increased 1.6% to $1,552.50 per ounce.
The VIX volatility index, Wall Street’s fear gauge, jumped 12% to 14.5. The U.S. dollar index fell 0.3% against a basket of currencies. The bottom line: the Dow had gained 22.3% in 2019, its best year since 2017.
Today’s 500-point reversal erased a portion of those gains in a single afternoon. Investors will note the divergence between falling equities and rising commodities — a pattern that typically signals shifting risk appetite.
Stock market fluctuations are a common feature of global financial systems, reflecting investor sentiment and economic conditions. Historically, market declines have been triggered by factors such as geopolitical tensions, shifts in monetary policy, or changes in commodity prices. The interplay between equities and commodities often highlights broader economic trends, with movements in sectors like technology and energy serving as indicators of investor confidence and risk tolerance.
The Dow Jones Industrial Average, comprising 30 major U.S. companies, is widely regarded as a barometer of the broader market’s health. Its performance is closely monitored alongside indices like the S&P 500 and Nasdaq Composite, which track a wider range of stocks. Significant single-day drops in these indices can prompt investors to reassess their strategies, particularly when contrasted with recent gains or losses in other asset classes, such as oil and gold.
Volatility, as measured by indices like the VIX, often spikes during periods of uncertainty, signaling heightened market anxiety. Meanwhile, movements in commodities like oil and gold can reflect broader economic dynamics, including supply concerns, inflation expectations, or safe-haven demand. Such divergences between equity and commodity markets underscore shifting priorities among investors, who may rotate capital in response to perceived risks or opportunities.
The broader context of market performance, such as the Dow’s strong gains in the prior year, provides a backdrop for understanding the significance of sudden declines. While single-day drops are not uncommon, their magnitude and sectoral impact can offer insights into underlying trends. Investors often analyze these patterns to gauge whether such movements represent temporary corrections or the beginning of a more sustained shift in market conditions.
{“@context”: “https://schema.org”, “@type”: “NewsArticle”, “headline”: “Dow Drops 500 Points In Worst Day Since December 2019”, “description”: “NEW YORK, January 3 — The Dow Jones Industrial Average fell 500 points today, closing at 28,634.88. That 1.8% decline marks the index’s worst single-day…”, “datePublished”: “2026-07-09T09:30:00+00:00”, “author”: {“@type”: “Person”, “name”: “Ava Anderson”}, “publisher”: {“@type”: “Organization”, “name”: “InfoPulse Today”, “url”: “https://newsfeed.infopulsetoday.com/”}}