In 1990, China burned 8 per cent of the world’s primary energy. By 2010 the figure was 20 per cent. That jump, from one-twelfth to one-fifth of global use in twenty years, is the quickest way into what a 2012 paper from the Australian Treasury calls China’s emergence in global commodity markets.
The authors, Brendan Coates and Nghi Luu, published their analysis on 29 March 2012. Their starting point was the reform period that began in 1978. Since then, they wrote, growth of around 10 per cent a year had been built on heavy investment, which pushed industrialisation, urbanisation and a boom in car ownership. The economy doubled in size every seven to eight years. Investment alone reached 49 per cent of GDP in 2010, up from 35 per cent in 1980.
Cities and cars
People moved. China’s urbanisation rate rose from 19 per cent in 1980 to 50 per cent in 2011, and the United Nations projected 73 per cent by 2050. Every new city dweller needed housing, roads, rail and power lines, and that is where much of the steel and copper went. The paper notes that the bulk of both metals was used in construction and infrastructure.
China’s accession to the World Trade Organisation in 2001 added a second engine. A manufacturing boom followed, and with it demand for aluminium and steel in machinery, vehicles and home appliances. Manufacturing made up 40 per cent of GDP.
Oil, coal and a little gas
Coal supplied 70 per cent of China’s energy, against 30 per cent worldwide. China’s share of global coal consumption reached almost 50 per cent in 2010, from 29 per cent in 2000. Despite large domestic reserves, it had become the world’s second largest importer of both thermal and coking coal, behind Japan.
Oil told the same story. Consumption grew at 6.8 per cent a year over the past decade, and China switched from net oil exporter to net importer, becoming the world’s largest importer in 2008. A year later it passed the United States as the largest oil consumer, and as the biggest car market. Natural gas was still small, just 3 per cent of the energy mix, though its use had grown by an average of 15 per cent a year over ten years.
Metals at 40 per cent
Copper and aluminium consumption each climbed by roughly 16 per cent a year across the decade. China became the biggest consumer of steel, aluminium and copper, taking around 40 per cent of each. The paper says that share was two to three times what Japan or South Korea reached at the peak of their own metals booms.
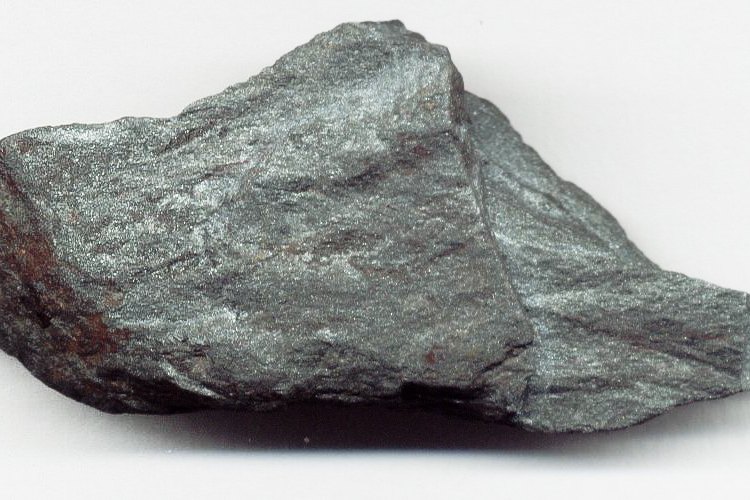
Iron ore showed the pull even more clearly. China’s share of global consumption more than doubled after 2000 to reach 52 per cent in 2010. Domestic mines supplied 15 per cent of world output but could not keep up, so China took around 70 per cent of global imports in 2009. About 40 per cent of its ore came from Australia, an annual trade of around 280 million tonnes, or A$40 billion, in 2010-11.
Copper was the weak spot at home. Production lagged consumption, and China’s purchases equalled 40 per cent of world refined copper trade. Steel went the other way: China made almost half the world’s steel and had become a net exporter.
Farms held back
Farm markets barely felt the same shock. Only 15 per cent of world food production crosses borders, and Beijing wanted self-sufficiency, restating in December 2010 a policy of 95 per cent self-sufficiency in grains. China was still the biggest consumer of wheat, soybeans and rice, and a main driver of rising world demand for soybeans, meat and dairy.
What the Treasury expected next
The authors saw room to run. Per capita energy use stood at only one-third of the OECD average, and China had about 50 cars for every 1000 people, against 500 in the United States. They cited the International Energy Agency’s estimate that China would account for 23 per cent of global energy demand by 2035. They also expected metals intensity to level off and then fall, as it had in Japan and South Korea, once investment rates declined.